CYP2C9 Gene Expression

A gene is a coded genetic material called DNA. Each gene contains information required to produce gene products, mainly proteins, which are needed for cell function and for organisms to survive. Just as in our daily life we buy or use things, as we require, similarly these genes make gene products in the body as when required. This on and off mechanism is called Gene Expression. Gene expression is the process by which the information encoded in a gene is used to direct the assembly of a protein molecule (Gene expression).

Regulation of Gene Expression:

Genes are expressed either as RNA or proteins. However, as mentioned earlier not all gene products are required at all point of time in a cell and also the amount of protein required might vary as per the demand of the particular organ. So, based on the external and internal requirements and other environmental factors, the cells need to decide how much gene expression is necessary for it.

The amounts and types of mRNA molecules in a cell reflect the function of that cell. Thus, the primary control point for gene expression is usually at the very beginning of the protein production process — the initiation of transcription. RNA transcription makes an efficient control point because many proteins can be made from a single mRNA molecule. Eukaryotic transcripts are also more complex than prokaryotic transcripts. Different cell types have varying gene expression profiles because of presence of distinct transcription regulators. DNA sequence usually has a promoter sequence to which RNA polymerase can bind and thus start the transcription process. Along with the promoter sequences, there are also enhancer sequences on DNA, which provide binding sites for regulatory proteins that affect RNA polymerase activity. These regulatory proteins can either increase or decrease the transcription process, thus influencing the expression of a gene in a cell (http://www.nature.com/scitable/topicpage/gene-expression-14121669),(http://study.com/academy/lesson/what-is-gene-expression-regulation-analysis-definition.html)

Epigenetics and DNA Methylation:

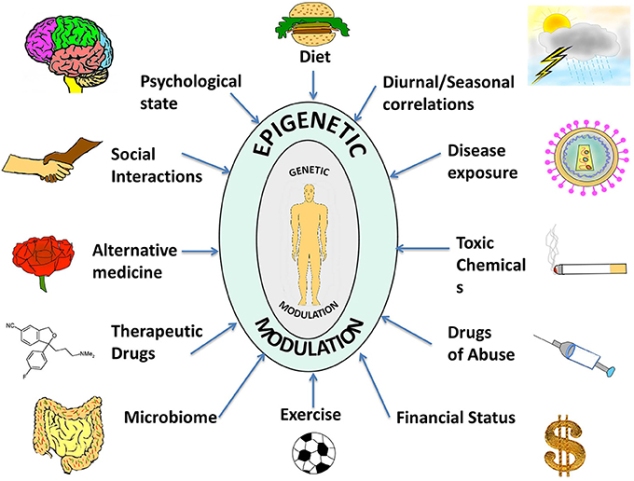
One important aspect in gene expression is that it does not only depend on the gene’s DNA sequence but is also influenced by the epigenetic or external environmental factors. Thus, Epigenetics is the study of changes in gene expression, which is controlled by external factors other than the gene’s DNA sequence, and these changes are heritable in nature. Epigenetic changes can switch genes on or off and determine which proteins are transcribed. It is also involved in many cellular processes and thus all our cells have the same DNA but get differentiated into different types of cells in the body such as neurons, liver cells, pancreatic cells, etc. (http://www.nature.com/scitable/topicpage/epigenetic-influences-and-disease-895)

epigenetics

Source:journal.frontiersin.org

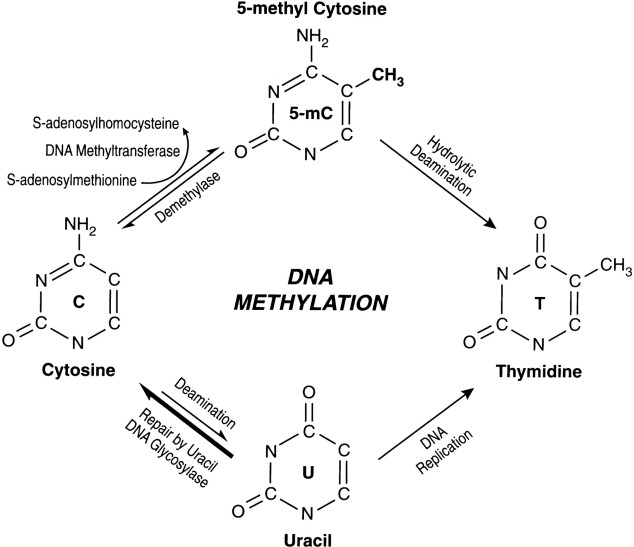
DNA methylation is an epigenetic mechanism in which a methyl (CH3) group is added to a DNA. It usually happens in a region where a cytosine nucleotide is located next to a guanine nucleotide linked by a phosphate, this is a called a CpG site. In the bulk of genomic DNA, most CpG sites are heavily methylated while CpG islands (sites of CpG clusters) in germ-line tissues and located near promoters of normal somatic cells, remain unmethylated, thus allowing gene expression to occur.  When a CpG island in the promoter region of a gene is methylated, expression of the gene is repressed (it is turned off). ( http://www.whatisepigenetics.com/dna-methylation/)

methyl

Source: www.bloodjournal.org

In previous blogs we have discussed mainly about the CYP2C19 gene, but for this part of the blog we will be analyzing gene expression for CYP2C9 gene. Using the Tissue-specific Gene Expression and Regulation (TiGER) database curated by John Hopkins University, we can observe the tissues in which the CYP2C9 is mainly expressed:

Screen Shot 2015-11-29 at 9.18.34 PM

Screen Shot 2015-11-29 at 9.22.36 PM

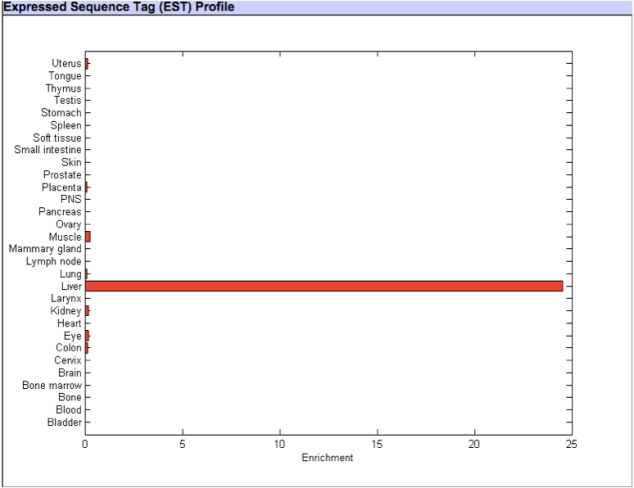
CYP2C9 Gene expression – TiGER database

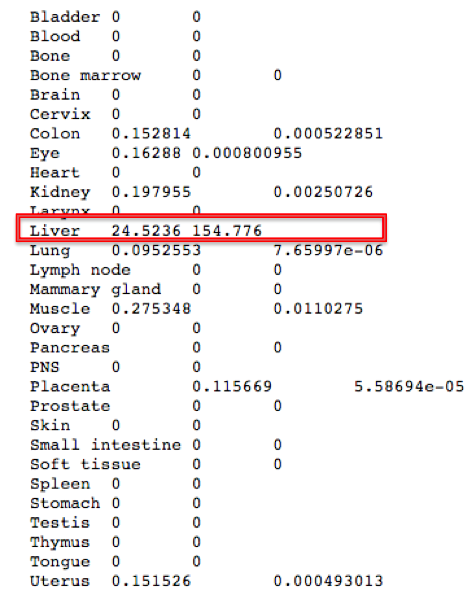
From both figures above of the Expressed Sequence Tag (EST) Profile, it can be observed that the CYp2C9 gene is mainly expressed in the liver with a small amount expressed in uterus,muscle,colon,kidney and eye. (http://bioinfo.wilmer.jhu.edu/tiger/db_gene/CYP2C9-index.html).This information is concurrent with the genotype and phenotype details of CYP2C9 gene mentioned in OMIM.org . As per OMIM, the CYP2C9 gene belongs to the cytochrome P450 enzyme family which are mainly responsible for metabolism of drugs such as anti-coagulant warfarin, anti-diabetic drugs tolbutamide and glipizide and anti-convulsant phenytoin. These drugs mostly have hepatic metabolism pathway and thus, we could agree with the TiGER database of the CYp2C9 gene being specifically expressed in liver.

Similar results were seen with The Human Protein Atlas database as seen below:

Screen Shot 2015-11-29 at 10.10.55 PM

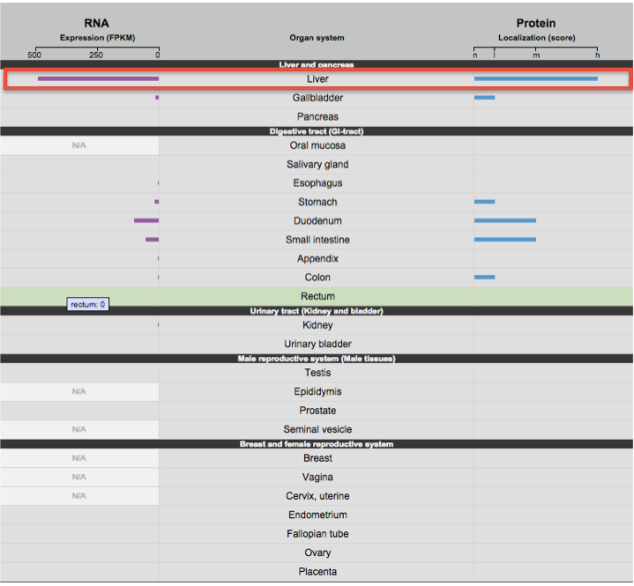
The RNA Expression and Protein Localization for the CYp2C9 gene is highest in liver followed by duodenum, small intestine, colon,kidney and appendix.

In order to study the epigenetic effect through DNA methylation in the CYP2c9 gene, the NCBI Epigenomics ‘Browse Experiments’Tool was used to yield the following results:


Screen Shot 2015-11-29 at 11.03.50 PM

Screen Shot 2015-11-29 at 11.06.22 PM

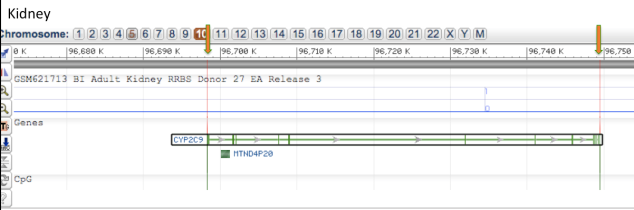
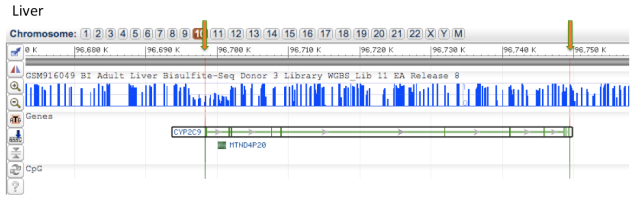
Epigenomic Analysis of DNA methylation of Kidney and Liver tissue for CYP2C9 gene

Comparing the DNA methylation of CYP2C9 gene on chromosome 10 in adult kidney and adult liver tissue shows that there are no CpG islands within the gene which is highlighted by the orange arrows. Also it can be seen that the kidney tissue has almost no methylation, whereas the liver tissue has very high methylation across the gene.

Lastly, to compare RNASeq and Microarray technologies for evaluation of differential gene expression of CYP2C9 gene, I used the huge Neuroblastoma dataset and narrowed down my search to the CYP2C9 gene in the gene data bank. I found only one entry for the gene, which is documented below:

Screen Shot 2015-11-30 at 9.35.11 AM

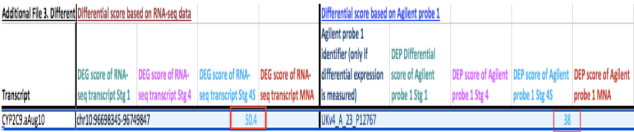
As seen in the figure above, the differential score for Tumor Stage 1 and Tumor Stage 4 has not been reported. But for Tumor Stage 4S the differential score was 50.4 for RNASeq which down regulated to 38 for the Microarray technology. Thus, it proves that RNASeq is a better differential technique to use as compared to  Microarray.

Comparing Sequences of the CYP2C19 Gene Across Different Species

Few years ago, due to lack of technology and advanced lab facilities, protein sequencing was one of the last methods used to obtain information about the functional proteins encoded in a gene. But today the scenario has changed; with decreasing cost and wide use of techniques such as whole-genome sequencing and whole-exome sequencing, as well as development of rapid methods for sequence comparison such as heuristic algorithms and parallel computers,protein sequence comparison across different species has now become the primary source to gain knowledge about the biological function of a gene. It is the most powerful tool for analyzing and studying protein sequences because of the enormous amount of information that is preserved throughout the evolutionary process. Proteins that share a common ancestor are called homologous proteins and they always share a common three-dimensional folding structure and often share common active sites or binding domains, which can be useful from a pharmacogenomics point of view in drug design and discovery of targets for drugs. One of the important aspect of comparing sequences is to find biological properties of proteins that ave been conserved overtime in different species ( http://people.virginia.edu/~wrp/papers/ismb2000.pdf). A conserved sequence is a sequence of amino acids in a polypeptide or of nucleotides in DNA or RNA that is similar across multiple species. A known set of conserved sequences is represented by a consensus sequence ( http://ghr.nlm.nih.gov/glossary=conservedsequence).Sequence comparison method can be used for selecting functionally significant site in a sequence as well as for predicting protein functional class (http://www.ncbi.nlm.nih.gov/pubmed/18763738).

CYP2C19 Gene – Sequence Comparison

The NCBI BLAST ( Basic Local Alignment Search Tool ) is a very useful source for sequence comparison among different species. The program compares the protein sequences to sequence databases and calculates the statistical significance of matches. It is helpful for finding local similarity between sequences and also it generates an evolutionary distance tree of all the sequences, which helps to visualize and calculate the evolutionary distance between the comparison species of interest. The NCBI protein id for the human CYP2C19 – NP_000760.1was searched for in BLAST, limiting the search results to refseq proteins and mammals. The search query in BLAST generates a table of results showing sequences for Homo sapiens and other matched species. It also gives an Accession Id for each sequence indicating whether the sequence for that particular species is actual ( NP) or Predicted (XP). The total score is used to see the similarity between the reference sequence and the compared sequence and the Indent value gives an estimate of evolutionary distance between the species compared with humans as the reference.

For the CYP2C19 gene, most of the sequences producing significant alignments generated by BLAST were predicted sequences(XP) and not the actual ones(NP). So, NCBI Gene and NCBI Protein database were searched for actual protein sequences of species other than human.After exploring all the three search options, the following species were selected for sequence comparison:

Species Selected for Sequence Comparison using BLAST, NCBI GENE and NCBI PROTEIN sources

Species Selected for Sequence Comparison using BLAST, NCBI GENE and NCBI PROTEIN sources

Of these six selected sequences, the human, cow and sheep protein sequences are actual, whereas the seqences for small-eared galago and common marmoset are predicted.The horse protein sequence is provisional and has not been yet subjected for final NCBI review (http://www.ncbi.nlm.nih.gov/protein/603843768?report=genbank&log$=protalign&blast_rank=42&RID=4CTZ2RVX016). From BLAST results, we can see that the total score for humans is 1011 whereas its 863 for small-eared galago, 859 for common marmoset and 822 for horse. So, in terms of similarity, small-eared galago differs by 148 points from human,and common marmoset and horse differ by 152 and 189 points respectively. Looking the evolutionary distance estimate in form of Indent value, it can be observed that it is 14% for both small-eared galago and common marmoset whereas it is 18% for the horse (http://blast.ncbi.nlm.nih.gov/Blast.cgi).

The MegAlign Pro feature of DNA Star was used for sequence comparison of all the above mentioned six species. The sequences in FASTA format were realigned using Clustal Omega algorithm. The results consisted of protein sequence comparison consecutively in rows, distance values table and an evolutionary tree which is shown in the figure below:

Evolutionary Distance Tree

Evolutionary Distance Tree

The sequences were renamed in this tree, with the common species name for ease.From this tree, we can an overall idea about which species are close to each other in terms of similarity of sequences without going through the actual Distance score.For our analysis, the Human CYP2C19 protein sequence seems to show some similarity with the common marmoset protein, but it is quite different from the remaining species.

Distance Table for Sequence Comparison

Distance Table for Sequence Comparison

It can be interpreted from the Distance table that common marmoset and small-eared galago are closest to human (0.14) in terms of evolutionary distance whereas, sheep is the farthest(0.33). Sheep and cow have the least evolutionary distance of 0.06 whereas cow and common marmoset has the maximum evolutionary distance of 0.35.

The image below highlights the R433W variant site for the CYP2C19 gene and also allows us to compare it with sequences from other species a consecutive sequence comparison view. The variant site is highlighted in red.

Sequence Comparison-Highlighting Variant Site R433W for CYP2C19 gene

Sequence Comparison-Highlighting Variant Site R433W for CYP2C19 gene

We can observed that the arginine(R) at variant site R433W in the human CyP2C19 gene is similar for all the five non-human species as well as for the consensus, thus summarizing that it has remained quite conserved throughout the evolutionary time.

MegAlign Pro also allows us to select a reference sequence and compare the remaining sequences against it using its Comparison feature. For the purpose of this comparison, the human CYP2C19 protein sequence was selected as the reference sequence and compared against the remaining five species for a total of 20 amino acids in N to C direction, including the variant site.

Color only matches to Reference Human CYP2C19 Protein Sequence

Color only matches to Reference Human CYP2C19 Protein Sequence

The variant site R433W is highlighted in blue and in the Comparison feature- Color only Matches to Reference is selected. We can see that in both N and C direction from the variant site most of the amino acids have been conserved in the evolution process for all the species.But at position 423, except for human and common marmoset,who have asparagine (N) amino acid in their sequence, the remaining species have aspartic acid (D) at that position, indicating some evolutionary changes that have been inherited in different species.Similarly at position 434, it is valine (V) for cow and sheep ( they also have minimum evolutionary distance ) as compared to isoleucine(I) for the remaining mammals.At position 436, only small-eared galago has a different amino acid alanine (A), whereas all others have valine and thus seems to be an important region for researchers from evolution point of view.

Color Only Differences from Reference View

Color Only Differences from Reference View

The Color Only Differences from Reference option also highlights that most of the amino acids are conserved for the all the six species for positions 423 to 443.The major differences are seen at position 433, where cow, horse,small-eared galago and sheep as well as the Consensus sequence have aspartic amino acid instead of asparagine.But, the remaining differences, it on individual species level with the Consensus sequence resembling the reference Human sequence in context of similarity. The closeness in evolutionary distance between cow and sheep can be observed clearly in this figure, as both the species have common amino acid replacement at position 423,424,427 and 434 when compared to Human protein sequences. The common marmoset protein has two unique amino acid difference at position 426 and 430. At position 426, all other species have methionine(M) whereas common marmoset has isoleucine, similarly at position 430 it has threonine(T) and others have alanine(A).

Show Only Differences from Human Reference Sequence

Show Only Differences from Human Reference Sequence

The Show Only Difference from Reference option concludes that cow and sheep sequences mainly are different with reference to human sequence and most of the amino acids for this 21 positions have remained conserved in all the six species throughout the evolution period.

Diagnostic Genome Analysis- Discovering the Undiscovered Secrets of Genes and Genomes

A four-year old boy named Nicholas Volker, who like all other kids loves batman and gun fights arrives at Children Hospital in Wisconsin in 2007 with a mysterious bowel disease leaving the doctors baffled regarding the diagnosis and treatment options. Food, which is a basic necessity for any human being to survive, became a dream for Nicholas because of his rare case of extreme irritable bowel syndrome causing holes in his intestine and leaking of fecal matter in the abdomen. At the young age of four he had already survived 100 surgeries with his colon removed, leaving him in a state of malnutrition and lose of hope to lead a normal life. His doctors had tried almost every diagnostic test and treatment possible to treat such a condition but with no success. After exhausting nearly all the medical options, his doctors decided to perform whole genome sequencing of Nicholas’s DNA to unfold the mystery of his rare medical condition. In November 2009, they were finally able to track down the genetic variations in Nicholas’ s genome sequence and identified that a mutation in the XIAP gene on the X-chromosome was responsible for this little boy’s suffering. A G to A mutation that led to an amino acid substitution and finally formation of an incorrect protein, which made his own immune system attack the healthy cells of the intestine.

The Mysterious Bowel Disease Story of Nicholas Volker

The Mysterious Bowel Disease Story of Nicholas Volker

The treatment was bone marrow transplantation and today this light blued eye is in remission. This case is an excellent example of sequencing techniques, which have started an entire new era in the medicine and genetic world.(One in a Billion-Nicholas Volker)

Initially sequencing techniques were only used for identifying rare hereditary disorders, but with the decreasing cost and availability of high end cutting technologies, it has now become possible to sequence entire human genome in comparatively less time and cost. The entire human genome can now be sequenced in less than one week and can cost anywhere between 5000-10,000$. (The Promise and Challenges of Next-Generation Genome Sequencing for Clinical Care). Whole genome sequencing or WGS is a process used to analyze the entire DNA sequence of an organism’s genome at a single time. In this technique, the DNA sample of an individual is collected and than the 3 billion nucleotides which comprise of human genome are studied against a reference sequence to identify any mutations in coding as well as non-coding regions, which can further help to provide precision treatment approach to the patient. The other sequencing technique is known as Whole Exome Sequencing, which involves sequencing of an exome (protein-coding region of human genome). This technique is less time consuming and more cost-effective, since the exome represents less than 2% of the genetic code but contains approximately 85% of the disease known variants(Exome Sequencing). WGS and WES are now being used more frequently especially in the field of pharmacogenomics to develop a personalized treatment approach for patients.

Whole Genome Sequencing Source- Knowgenetics.com

Whole Genome Sequencing
Source- Knowgenetics.com

Exome_Sequencing_Workflow_1a

Exome_Sequencing_Workflow_1a

Exome_Sequencing_Workflow_1b

Exome_Sequencing_Workflow_1b

Next generation sequencing methods are useful for screening neonatal blood for early diagnosis of thalassemia and also for identification other novel mutations associated with it (http://Pediatr Res. 1992 Mar;31(3):217-21.) It also helps to diagnose and treat medical conditions that are difficult to diagnose using routine clinical and laboratory criteria. WGS can also be used to identify mutation in M.tuberculosis gene that are associated with antibiotic resistance and are likely to be responsible for phenotypic resistance (http://J Clin Microbiol. 2015 May;53(5):1473-83. doi: 10.1128/JCM.02993-14. Epub 2015 Feb 11). This can further help to design an effective, cost and time saving treatment approach which would not only benefit the patient but also the health care system.

Some of the advantages of WGS and WES are that they can be used for extensive research purposes for discovering novel mutations, for population screening, for neonatal screening as well as for pre-symptomatic testing. WGS is superior to WES in terms of sequence coverage. A low average read depth is required for WGS as compared to WES. The main challenge with doing WGS is generation of enormous data for which large storage and data analysis capacity is required. This is not an issue with WES technique, which only targets for protein coding regions and thus reduces storage and analysis cost making it possible to sequence larger population based comparisons (http://www.nature.com/ejhg/journal/v21/n1s/full/ejhg201346a.html#bib6)

With the advancement in sequencing techniques came the concept of Direct-to-consumer (DTC) genetic testing. Companies such as 23 and Me, Full Genomes Corporation (http://www.isogg.org/wiki/List_of_DNA_testing_companies) and other provide genetic test results directly to the patient without involving a health care provider. This kind of services can be beneficial when a person wants to know his ancestry, wants to improve his/her lifestyle by acquiring knowledge about his risk for genetic mutations and associated phenotype as well as for public education and awareness. But the disadvantages of such testing are more when compared to the advantages. Since, a health care provider is not involved in the delivery of these genetic test results, the chances of misinterpreting the outcomes increases. Moreover, The Genetic Information Nondiscrimination Act of 2008 (GINA) does protect the consumers against discrimination based on genetic testing, but it has several loopholes in it. The law still allows insurance companies to utilize genetic test results in determining insurance payments and the DTC genetic test results can be misused by insurance providers in terms of coverage offered to an individual. Genetic privacy is also becoming a major concern in this area, as there are currently no strong laws to prevent an individual’s genetic information from getting public. Emotional impact of learning about being a carrier of any genetic disease can be huge and can lead a person to anxiety, depression and suicidal tendencies (Direct-to-consumer genetic testing).

With this background, let us analyze a situation in which a hypothetical patient Mary is found to be homozygous for a poor metabolism associated mutation ARG433TRP of the CYP2C19 gene. Because of the mutation in her gene, Mary is has low metabolizing capacity for drugs such as anticonvulsant Mephenytoin and tolbutamide. From past one year, Mary has been on a diagnostic odyssey due to her poor response to drugs and has developed multiple medical conditions, which does not show positive signs of improvement due to low metabolism of the drugs given to her. Having exhausted all the traditional diagnostic options available, Mary and her family have decided to opt for any of the following options:

  • Participate in a clinical trial offering full exome analysis for Mary and her parents at no personal cost.
  • Seek full genome analysis and work with their insurance provider to seek coverage, a 4-6 month negotiation.
  • Pay out of pocket for the full genome analysis ($5-10k).
  • Use direct-to-consumer services and perform independent analysis of the raw results.

Since most of the allelic variants for CYP2C19 gene are found to be polymorphic in nature, in my opinion Mary and her parents should first go for a clinical trial offering full exome analysis at no additional cost.This would help her confirm the presence of a genetic mutation in her gene and would also help to identify any other novel variant responsible for the loss of function of the CYP2C19 gene. Also, it has been seen that CYP2C19 gene alleles alone are not attributable for the loss of metabolizing function and there might be other genes responsible for t. To know this Mary and her family might consider undergoing WGS after negotiating with their insurance provider. But upon weighing the benefits and cost factor of WGS versus WES; in Mary’s case WES would be a better choice. As it has been seen that most of the alleles of the CYP2C19 gene are seen at a low frequency rate in the population and also not all the allelic variants are associated with a phenotypic effect. So, doing WGS would not only cost more for Mary and her family but also consume time and generate a huge amount of repetitive data which might not prove to be extremely useful for her (http://www.ncbi.nlm.nih.gov/pmc/articles/PMC3748366/). DTC should not be considered in this case, because the genetic findings obtained need to be utilized for a precision dose adjustment of drugs and that is only possible through a health care provider or a primary physician.Thus, looking at the low frequency rate of the allele of the CYP2C19 gene and its less deleterious effect in terms of disease potential, WES is the best choice for Mary and her family.

Incidental findings: While conducting WGS and WES, a large amount of clinically relevant data is generated, which might also include some secondary or incidental findings for which Mary had not ordered the diagnostic testing. If in a clinical trial, than an informed consent should be obtained from Mary and her family regarding the return of incidental findings as per IRB andThe American College of Medical Genetics and Genomics guidelines (https://www.acmg.net/docs/IF_Statement_Final_7.24.13.pdf). If the researchers and analyst come across any novel genetic mutation , which might be playing a major role in the phenotype of Mary apart from the common allelic variant and if the benefits of disclosing this information to her outweighs the potential risks associated with it, than these secondary findings should be returned to Mary and her following after following all the necessary procedure for it.

Mary and her family decide to go for WES and they later received a USB drive with a VCF file for their genome analysis. The raw data in this VCF can be used through NCBI source to verify whether the sequencing confirmed the presence of disease causing variant as follows:

Using http://omim.org/ the rsID for ARG433TRP allelic variant of the CYP2C19 gene was identified as rs56337013

rsID for ARG433TRP variant of CYP2C19 Gene

rsID for ARG433TRP variant of CYP2C19 Gene

Navigating through the SNP data base of NCBI and entering the rsID for the variant gives the following result:

SNP file

SNP file

We can than go to the VarView link at the bottom of the page and zoom in to identify the protein sequence for our variation site 

VarView of SNP Database highlighting the rsID and position of variant site

VarView of SNP Database highlighting the rsID and position of variant site

Hovering the cursor over the rsID gives the position number of variant site relative to position of chromosome on which the gene is located. The position number for this variant was 94852738

Position Number of Variant Site

Position Number of Variant Site

Clicking on the exon view indicates the start and end position of exon containing the variant site as follows:

Exon range including variant site

Exon range including variant site

As seen in the figure the beginning and end positions of exon range including the variant site were 94852733 and 94852914 respectively.

The single line VCF formatted data for a patient homozygous for ARG433TRP allelic variant of the CYP2C19 gene is indicated as below:

VCF single line formatted data

VCF single line formatted data

3D Structure view of Human CYP2C19 Gene

The technological advances in this techno-savy age are gradually converting this globe into a Virtual 3D World, where people prefer to view everything in a tertiary structure; right from playing a 3D video game to a 3D painting to designing a 3D  protein structure. In medical field, 3D printing has many implications such as designing customized prosthetics, tissue and organ fabrication,etc.( Medical 3D printing )

Visualizing a 3D structure of a gene or protein can be very useful from a bioinformatics perspective. It can be helpful for rational drug design, viewing sites associated with disease causing variants and also to see the proximity of amino acids that are distant in the primary sequence.As discussed in my previous post, the CYP2C19 gene is a monomer and a member of Cytochrome P450 family and is responsible for the metabolism of drugs such as anti-convulsant mephenytoin, anti-ulcer omeprazole and anti-malarial drug proguanil. An OMIM allele for CYP2C19 gene is.0003 ( p.TRP212TER (rs4986893) [dbSNP:rs4986893] ). A G to A mutation results in substitution of Tryptophan W at position 212 of protein sequence to a termination codon(X).This mutation leads to poor metabolism of proguanil and other drugs in individuals who are carriers for this variant.Using Protean 3D feature of DNA Star software we can visualize the 3D structure of Human CYP2C19 gene as follows:

In the above figure we can see a mixed backbone structure of gene which includes both ribbon and sphere design. From the style menu we can select different styles for the protein structure such as tube, balls and spheres, sticks, etc to customize it as per our visualization needs. Also below the 3D structure , there is the translated sequence of protein available along with the KSD secondary structure. We can highlight a portion of the sequence and the same gets highlighted in the tertiary structure, which helps us to gain an insight into the positioning of the amino acids i.e whether they are located on the surface or in the turn region or inside the helix.

When we highlight our variant location for allele 0.0003, i.e amino acid Tryptophan (W) at position 212, it gets reflected in the 3D structure as shown in figure below:

Highlighted position 212 for amino acid Tryptophan in allele .0003 of human CYP2C19 gene

Highlighted position 212 for amino acid Tryptophan in allele .0003 of human CYP2C19 gene

From this view, it can be seen that the variant position is located on the interior region (beta sheet ) of the helix. We can also see the variant location in different views and colors using the style menu :

3D Human CYP2C19 gene with highlighted variant position as blue spheres

3D Human CYP2C19 gene with highlighted variant position as blue spheres

Protean 3D allows us to use our creativity at its best and create different 3D view structures using various colors and design options available:

Sphere view of Human CYP2C19 gene with position 212 highlighted in green

Sphere view of Human CYP2C19 gene with position 212 highlighted in green

Tube structure view of Human CYP2C19 gene

Tube temperature structure view of Human CYP2C19 gene with highlighted allele position in green. The spheres seen in the above image represent the ligands and water in the structure.

Tube occupancy view of Human CYP2C19 gene with variant site highlighted in green

Tube occupancy view of Human CYP2C19 gene with variant site highlighted in green

In order to check the validity of protein structure prediction algorithm, we compared the tertiary structure of Human CYP2C19 gene to the secondary structure prediction Chou Fasman algorithm in the analysis view of Protean 3D:

Chou Fasman Secondary Structure prediction

Chou Fasman Secondary Structure prediction

The above figure indicates that our 3D structure prediction is valid, as even the Chou Fasman secondary structure prediction algorithm shows that the variant site which is highlighted in light blue is located in the yellow color beta region of the helix.

When we looked at the Hydrophilicity plots generated by Kyte-doolittle and Hopp Woods algorithm, it further confirmed that the 3D structure prediction algorithm does tally with the secondary structure:

Kyte-doolittle and Hopp Woods Hydrophilicity plots

Kyte-doolittle and Hopp Woods Hydrophilicity plots

Both the hydrophilicity plots show that the highlighted variant site falls in the orange region which is representative of hydrophobicity. Thus the allele position is located in a hydrophobic region which is located usually in the lipid bilayer in the interior of the helix.

The Emini algorithm predicts the surface probability for a highlighted region and for position 212, which is the variant site in OMIM allele .0003 of the Human CYP2C19 gene, the surface region indicated is line as shown in the image below:

Emini Surface Probability Algorithm

Emini Surface Probability Algorithm

The violet blocks represent the surface whereas the lines are for the interior beta sheet regions.The light blue highlighted variant site falls in the line area, confirming our results with other predictive algorithms.

Thus, Protean 3D not only helps us to view the tertiary structure of a human gene or protein , but also through its analysis feature it allows us to compare the validity of different predictive algorithms in order to confirm our results and to give accurate structure prediction using different style options.

click on the following link for more information on types of protein structure and their implications in clinical filed :

http://www.ncbi.nlm.nih.gov/books/NBK6824/